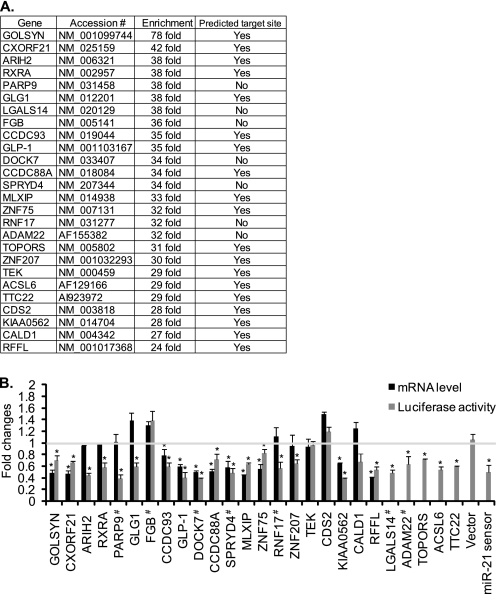
FIGURE 1.
Genes enriched by miR-21 pulldown. A, the 26 most highly enriched genes by bio-miR-21 pulldown in PASMCs. The presence of predicted target sites for miR-21 was identified by using PITA and RNA22. Accession indicates NCBI Reference Sequence accession numbers. B, overexpression of miR-21 down-regulates genes that are highly enriched by bio-miR-21 pulldown. Total RNAs were harvested from PASMCs transfected with control or miR-21 mimic, and mRNA levels of the indicated genes relative to GAPDH were measured by qRT-PCR. Fold change of mRNA levels of each gene in cells overexpressing miR-21 mimic in comparison with control (cel-miR-67) mimic-transfected cells is presented (black bars). COS7 cells transfected with luciferase construct containing full-length 3′-UTR or MRE of the indicated genes were transfected with control (cel-miR-67) or miR-21 mimic. # indicates the luciferase reporter constructs containing a full-length 3′-UTR, whereas the rest of the constructs contain only predicted miR-21 MREs. A luciferase vector carrying two copies of a sequence complementary to miR-21 (miR-21 sensor) and a luciferase vector without the 3′-UTR sequence (Vector) were used as positive and negative controls, respectively. Luciferase activity was then measured in triplicates. Fold changes by miR-21 mimic transfection in comparison with cel-miR-67 mimic transfection are presented (gray bars). Data represent mean ± S.E. *, p < 0.01.

