FIGURE 2.
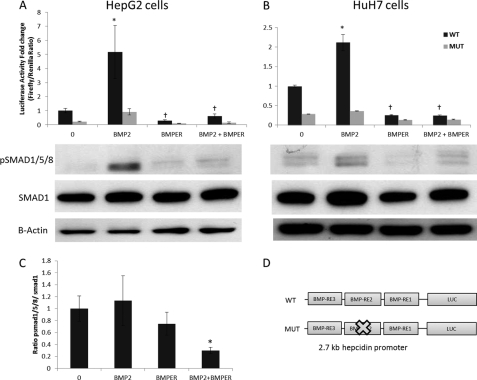
Effect of soluble BMPER on hepcidin promoter activity and pSMAD levels in HepG2 and HuH7 cells. A, luciferase assays showing effect of BMPER on BMP2-dependent activation on the WT hepcidin promoter and mutant (BMP-RE2) constructs in HepG2 cells. B, HuH7 cells treated as above. Lower panels, Western blots showing pSMAD1/5/8 levels in the respective cells under the same conditions. Cells were exposed to 25 ng/ml BMP2 and 2500 ng/ml BMPER or a combination of these. When given together, the molar ratio was 1:15 (BMP2:BMPER). C, densitometry from Western blots performed in triplicate showing the ratio of pSMAD1/5/8:SMAD1 in HepG2 cells (*, p < 0.05 BMP2 alone compared with BMP2+BMPER, Student's t test). D, diagrammatic representation of WT hepcidin promoter luciferase construct used with three intact BMP response elements (BMP-RE1–3) and mutated construct in which BMP-RE2 was mutated. Luciferase assays shown are means ± S.D. derived from a single experiment with three biological replicates, and the experiment shown is representative of three similar experiments (*, p < 0.001 control versus BMP2; †, p < 0.001 BMP2 versus BMPER and BMP2 versus BMPER+BMP2, multiple ANOVA with Tukey's post hoc analysis). Densitometry was performed on Western blots using three biological replicates for each condition.

