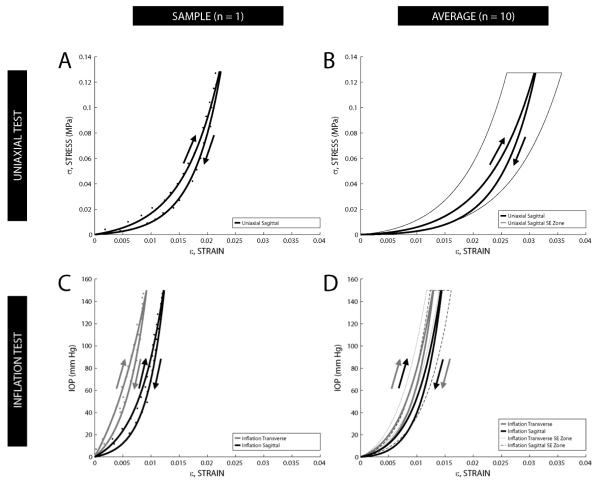
Figure 3.
(A) Sample stress-strain hysteresis data from one uniaxial tested eye; arrows indicate loading and unloading of tissue. (B) Uniaxial composite exponential curve fit of stress-strain hysteresis data (n = 10 pairs) for each half-cycle. (C) Sample stress-strain hysteresis data from one whole globe inflation tested eye. (D) Whole globe inflation composite exponential curve fit of IOP-strain hysteresis data (n = 10 pairs) for each half-cycle. Composite curves were generated by averaging the sum of the individual functions for each fit along the strain axis (i.e. 1/n Σεn(σ or IOP), n=10). A zone encompassing the standard error (SE) of the mean strain values for the loading portion of each of the three hysteresis loops is delineated by a thin dashed or solid line.

