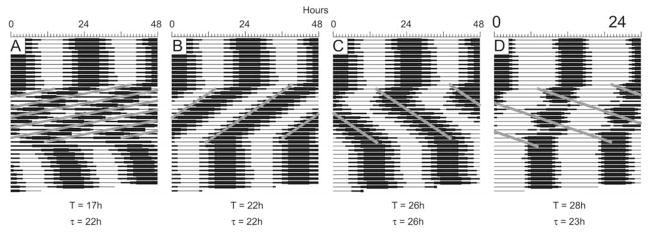
Figure 4.
Representative actograms depicting limits of entrainment. The period of the applied T cycle (the frequency with which the gate was exogenously triggered) is presented, as is the period of the system (τ), as calculated by cosine spectrum analysis. The systems were allowed to free run for about 12 cycles before the T cycle was applied (using the resetting function with a slope of 0.7). The T cycle was applied for about 12 cycles (indicated by the diagonal gray lines on the actograms), after which the system was allowed to free run again.

