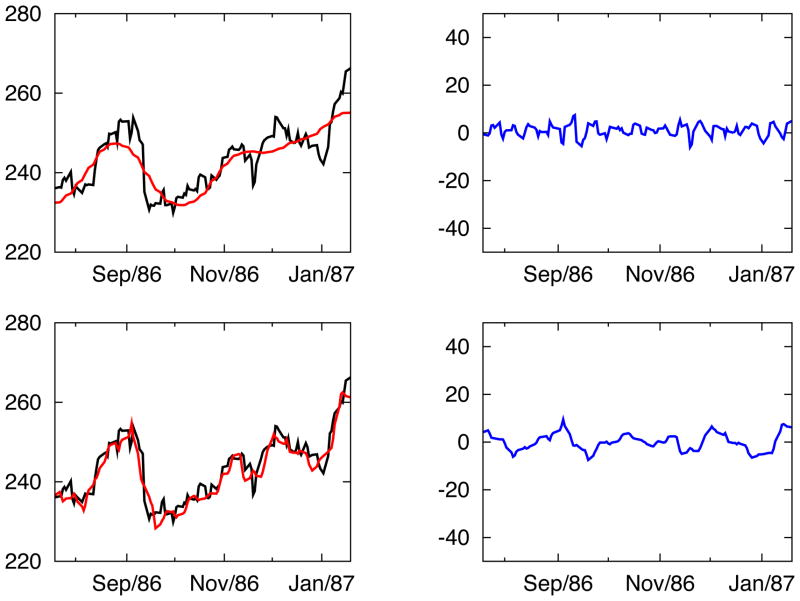
Figure 8.
IFD analysis for the half-year S&P500 index centered on Oct 19, 1986, one year before Black Monday crash. The panels and notations are same as those in Figure 7. The magnitude of the oscillations of various modes are much smaller than those in the year of big crash.

