
Figure 3.
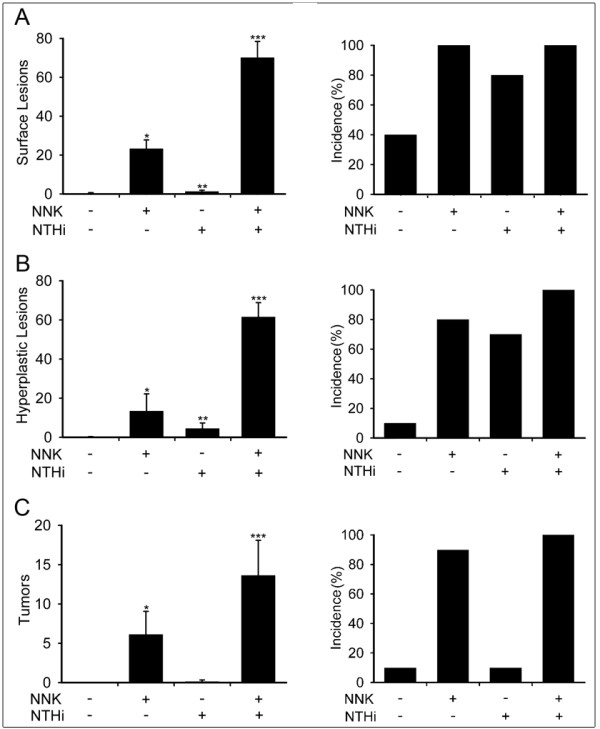
Analysis of lung carcinogenesis. (A) Lung surface lesion numbers (left) and incidence of lesion development (right) in Gprc5a-/- mice. (B) Number and incidence of hyperplastic lesions in the lungs of Gprc5a-/- mice. (C) Number and incidence of tumoral lesions in the lungs of Gprc5a-/- mice. (Incidence is calculated as the percentage of mice with surface lesions, hyperplastic lesions, or tumoral lesions among the total mice in the same study group, and presented as mean ± SE, *= P < 0.05 for NNK vs PBS, **= P < 0.05 for NTHi vs NNK, and ***= P < 0.05 for NNK/NTHi-exposed Gprc5a-/- mice vs NTHi-exposed Gprc5a-/- mice).