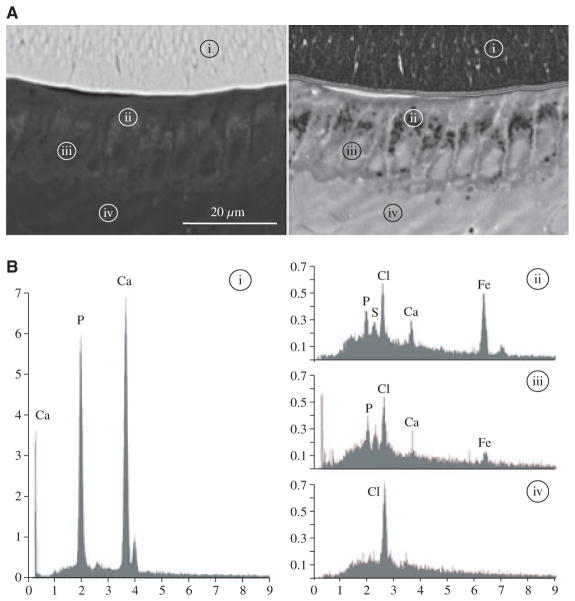
Fig. 4.
Backscatter scanning electron microscopy and energy-dispersive X-ray analysis (EDS). (A) Backscatter scanning electron microscopy of the incisor cross-section at the level of section 5 (Fig. 2) localizing the four sites where elemental analyses were performed. Left: backscatter scanning electron microscopy image. Right: backscatter scanning electron microscopy image that was sharpened and inverted using ImageJ to better show the backscatter from the ameloblast layer. (B) EDS spectra from the four areas localized in panel A: i, enamel layer; ii, ameloblast area with positive backscatter; iii, ameloblast nucleus without positive backscatter; and iv, papillary layer. Note the presence of iron (Fe, atomic number 26) in area ii and that the levels of calcium (Ca) and phosphorus (P) are also high. Cl, chlorine; S, sulphur. The x-axis numbers represent kiloelectron volts (keV), and the y-axis numbers represent counts per second per electron volt (CPS/eV).

