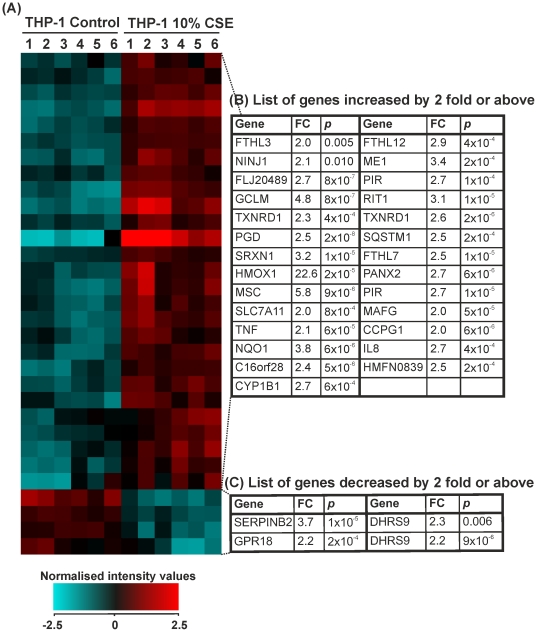
Figure 4. Expression of genes that were changed by 2.0-fold or above in THP-1 monocytes treated with control medium or cigarette smoke extract for 8 hours.
THP-1 monocytes were treated for 8 hours with RPMI-1640 medium (control 1–6) or CSE (1–6). RNA was extracted from each sample and gene expression values measured using the Illumina HumanRef-8v3 BeadChip array. (A) Heat map representation of normalized signal intensity values for genes altered by ≥2.0-fold. Red denotes high expression and turquoise denotes low expression. Order of samples was dictated by hierarchical clustering. (B) Table showing gene name, fold change and p-value for all genes upregulated by ≥2.0-fold. (C) Table showing gene name, fold change and p-value for all genes downregulated by ≥2.0-fold. Statistical significance (p<0.05) was calculated using student's t-test followed by Benjamini-Hochberg FDR correction on GeneSpring GX11.0.2 software. Fold change represents a comparison between mean normalised signal intensity for control (n = 6) versus smoke (n = 6) treated THP-1 monocytes. Refer to Data S1 full data sets and Entrez Gene IDs.

