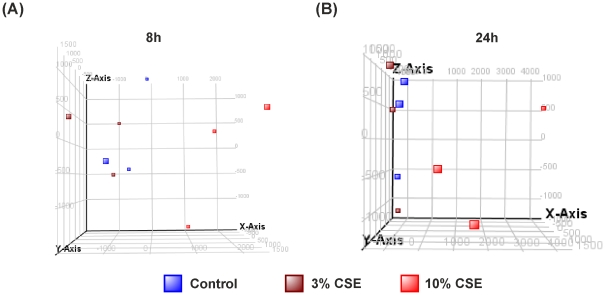
Figure 5. 3D Scatterplot from the principle conponent analysis of PBMCs treated with control media or cigarette smoke extract (CSE) for 8 and 24 hours.
PBMCs were treated with control media, 3% CSE or 10% CSE for 8 and 24 hours. RNA was extracted from each sample and gene expression values measured using HumanRef-8v3 Expression BeadChip arrays. Samples stratify according to treatment with 3% CSE (maroon), 10% CSE (red) and media treated controls (blue) from 3 individuals for (A) 8 hours and (B) 24 hours. Component % variance for 8 hours was; PC1 = 35.8%, PC2 = 27.6%, PC3 = 19.2%, PC4 = 17.4%. Component % variance for 24 hours was; PC1 = 44.1%, PC2 = 22.4%, PC3 = 18.8%, PC4 = 14.7%.

