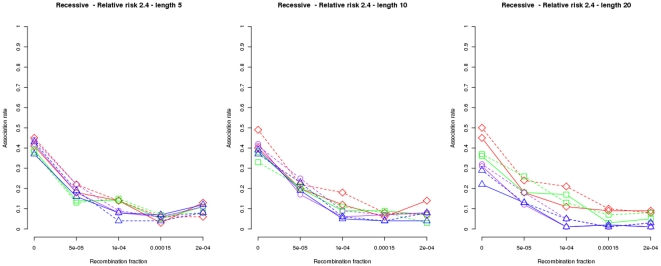
Figure 2. Association rates under the holdout approach using a second data set to test reproducibility.
Results for 100 simulations of  family trios as a function of the recombination rate using the recessive and one-locus genetic model and haplotypes of lengths
  (left plot),
  (plot in the middle) and
  (right plot). A nominal level of
  and a relative risk of
  were used for all plots. Results for

 and
and  i.e. all tests were applied under the holdout approach, are plotted in purple circles, blue triangles, green squares and red diamonds respectively. Dashed lines show results for a data subset of
  trios randomly chosen while solid lines show results for a second data subset of
  trios used to test reproducibility of the holdout approach.

