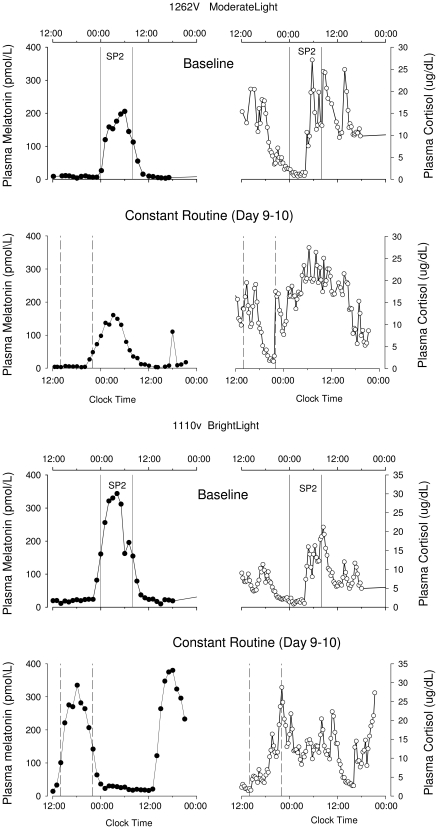
Figure 2. Plasma melatonin and cortisol rhythms.
Plasma melatonin and cortisol rhythms before (Baseline – SP2 – upper panels) and after (Constant Routine – lower panels) the gradual shift of the sleep-wake schedule, in a participant treated with moderate light (1262V) and a participant treated with bright light (1110V). The vertical solid lines indicate the eight-hour scheduled sleep/darkness episode (SP2) on the baseline day (D2), the dotted vertical lines indicate the projected eight hour sleep episode (based on the sleep period of the preceding night) during the constant routine.

