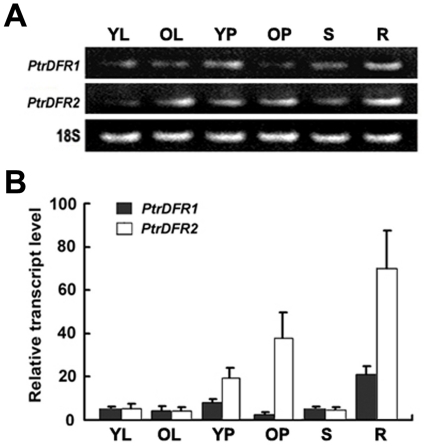
Figure 3. PtrDFR1 and PtrDFR2 transcript levels in different tissues of P. trichocarpa.
(A) Gel analysis of semiquantitative reverse transcriptase (RT)-PCR with transcript-specific DFR primers. (B) Expression levels were determined by qRT-PCR. Values represent averages of three biological replicates, each with two technical replicates. Actin expression of poplar was used as a control. Total RNA was isolated from poplar tissues: root (R), shoot (S), young leaf (YL), old leaf (OL), young petiole (YP) and old petiole (OP).

