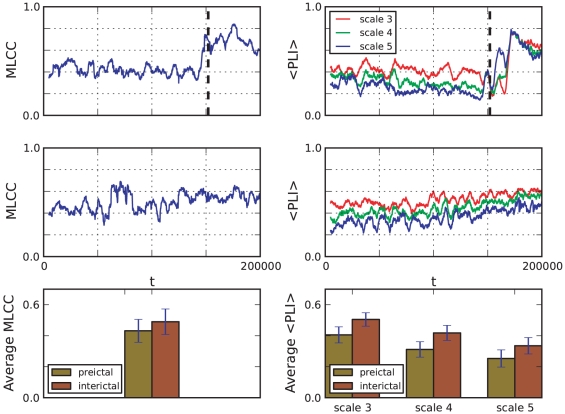
Figure 6. Decrease of synchronization measures during a pre-ictal interval.
Left column: time series of maximum linear cross correlation during a pre-ictal (top) and an inter-ictal (middle) interval. Right column: time series of  for three scales during a pre-ictal (top) and an inter-ictal (middle) period are depicted. Vertical dashed lines indicate the onset of the seizure attack. Averages over the first 150000 sample points of each time series indicate a distinct decrease of each synchronization measure during the pre-ictal interval (bottom row). Error bars show standard deviations.

