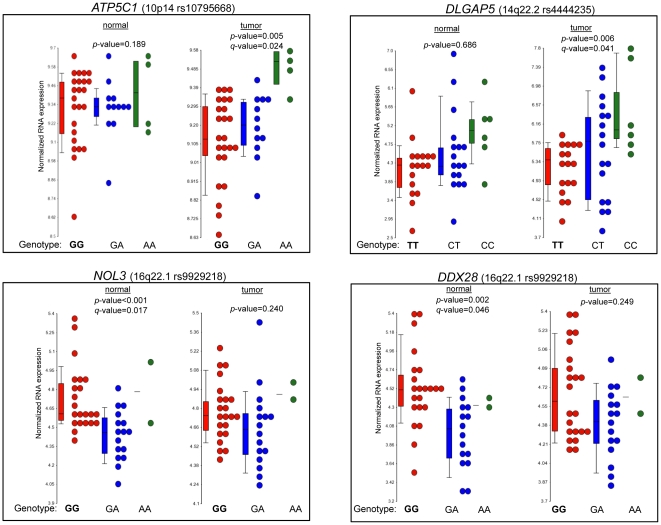
Figure 1. Expression of four genes found to differ by genotype for three colorectal cancer risk variants.
Box plots of normalized gene expression levels of ATP5C1, DLGAP5, NOL3, and DDX28 for paired adjacent normal colon tissue (n = 40) and colon tumor tissue (n = 40). Each point represents the normalized RNA expression levels for an individual. The median gene expression level for each genotype specific group is indicated by a line inside each box within the graph. The p-value indicates the significance of the global test comparing expression across genotypes. If the p-values were significant (p-value≤0.05), the FDR q-values were provided, indicating the significance after correction for multiple comparisons.

