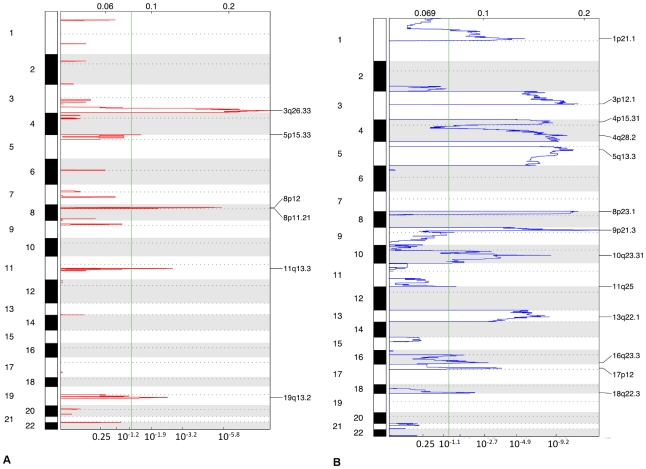
Figure 1. Genomic copy number alterations in lung squamous cell carcinomas.
Plots of high-level amplifications (a) and deletions (b) in 62 lung SCCs from GISTIC analysis of aCGH data. X-axis shows the G score (top) and false discovery rate (q value; bottom) with a green line demarcating a false discovery rate of 0.05. Labels on the right denote the peaks of the most significantly altered regions.

