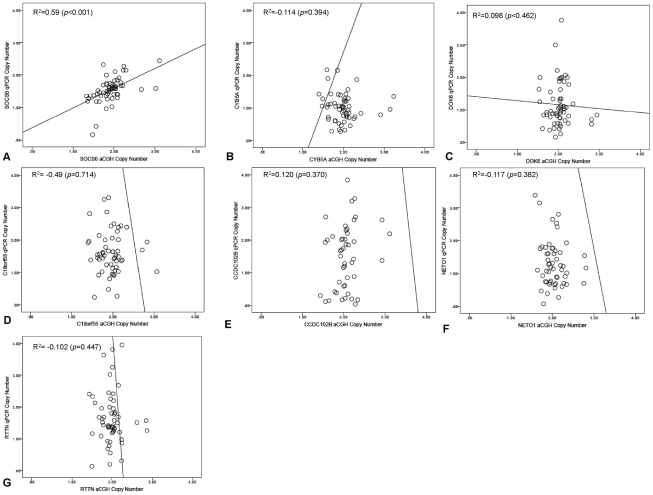
Figure 3. Quantitative PCR (qPCR) validation of array CGH identified candidate genes preferentially lost in SCC recurrence.
The Y-axis represents the derived DNA copy number from qPCR normalized to house-keeper genes, b-actin while the X-axis represents the DNA copy number derived from aCGH. Pearson's correlation coefficient was used to assess for any relationship between the copy number derived from the methods and p values<0.05 were deemed significant. The aCGH copy number of onlySOCS6 (a) was validated by qPCR.

