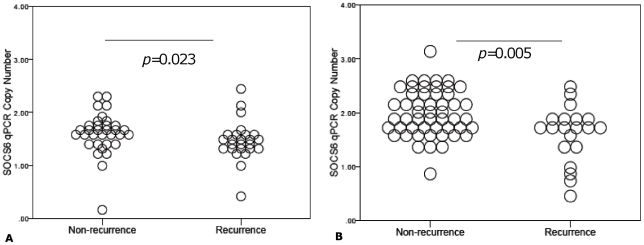
Figure 4. Dot plot of qPCR-derived SOCS6 copy number (y-axis) is compared to the recurrence phenotype (x-axis) in the training (n = 62) and test set (n = 72) subjects.
Figure 4A and 4B represent training set and test set subjects respectively. Mann-Whitney U test to was used to assess for any differences in copy number between recurrence phenotypes and p values<0.05 were deemed significant.

