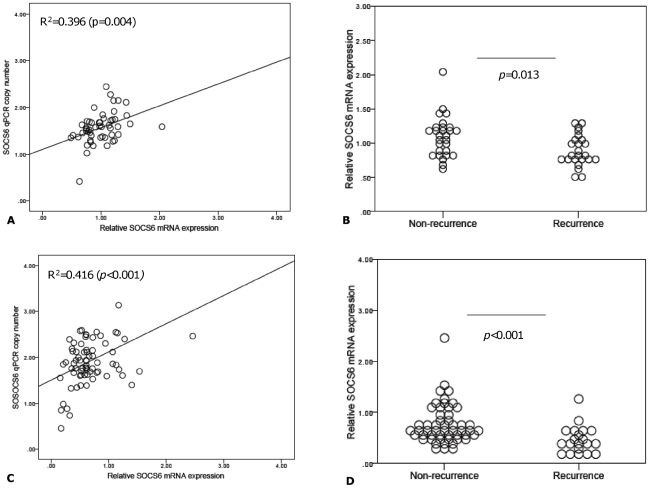
Figure 5. Relationship between SOCS6 mRNA expression, copy number and recurrence phenotype.
Figure 5A and 5C are scatter plots of qRT-PCR derived SOCS6 mRNA expression (x-axis) and qPCR-derived SOCS6 copy number (y-axis) in training set (n = 62) (a) and test set (n = 72) (c) respectively. Figure 5B and 5D represent SOCS6 mRNA levels (y-axis) ad recurrence phenotype (x-axis) in the training and test sets respectively. Pearson's correlation coefficient was used to determine any association between SOCS6 qPCR derived copy number and mRNA levels. Mann-Whitney U test to was used to assess for any differences in copy number between recurrence phenotypes and p values<0.05 were deemed significant.

