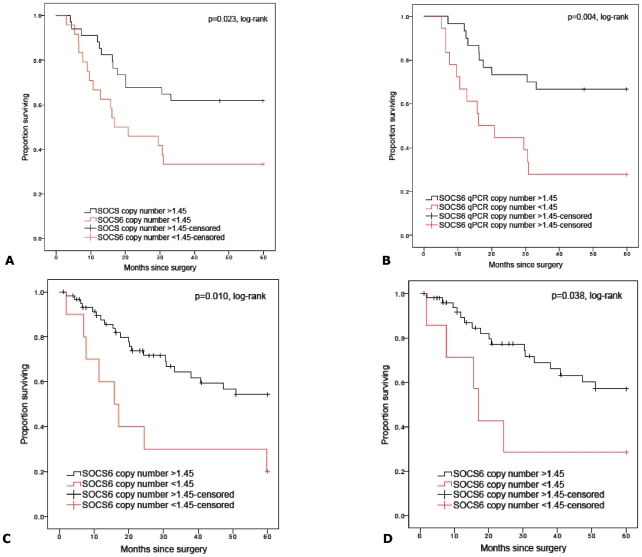
Figure 6. Kaplan-Meier curves of overall survival and SOCS6 qPCR-derived copy number in study subjects with follow-up duration of 5 years after surgical resection in the training set (n = 62) and test set (n = 72).
Figure 6A and 6B represent overall survival in all training set and TNM early stage subjects while 6C and 6D represent all test set and TNM early stage test set subjects. Censored values (+) indicate the last known follow-up time for those subjects still alive after surgical resection.

