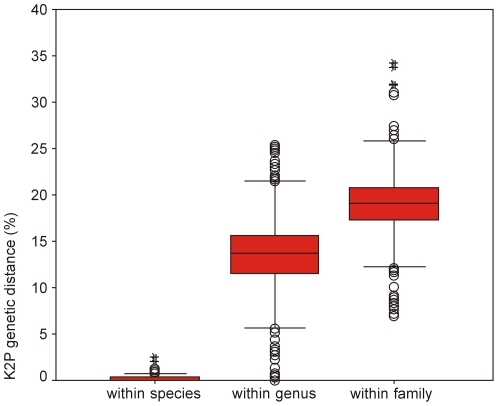
Figure 3. The distribution of K2P distances at COI sequences within species, genus and family respectively.
IQR: interval into which the central 50% of the data fall. Black bar in the box indicates the median. Circles indicate mild outliers and asterisks indicate extreme outliers. Extreme outliers are discussed in the text.

