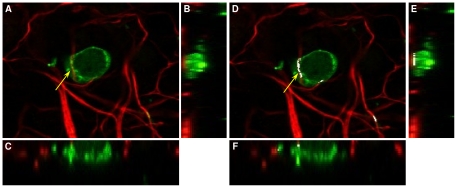
Figure 6. Comparison of CICα measurement and Manders' .
 using examples from murine organotypic brain slice cultures. (A) An example of a focal plane from murine OSC at 40× magnification, showing CICα = 0% using our method, (B) side view of the z-stack (view in the x and z plane) for Figure A, (C) view in the y and z plane for Figure A, (D) The same example image as Figure A showing the result using Manders' method, where the white region indicates co-localisation, (E) side view of the z-stack for Figure D, (F) bottom view of the z-stack for Figure D.

