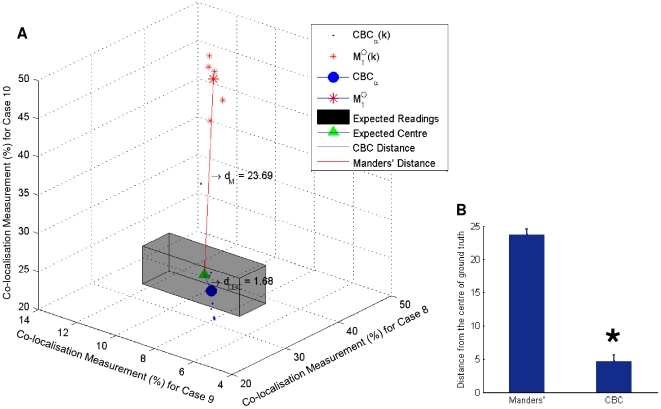
Figure 8. Performance comparison between CBCα and Manders' method shows that our co-localisation measurement is a lot closer to the ground truth value than measurements obtained using Manders' method with Otsu's thresholding method.
(A) Co-localisation measurements of CBCα(k) (blue dots) and Manders'  (red star) for all non-empty frames in test cases 8–10 is plotted. The range of ground truth is shown in the gray box with its centre Vt shown in a green triangle. The CBCα value, which is also the geometric centre of CBCα(k), is shown by the large blue dot, and the value of
  , which is the geometric centre of
  , is shown by the large red star. Results show that the distance between
  and Vt, dM = 23.06 is considerably larger than the distance between CBCα and Vt, dCBC = 1.68, which suggests greater accuracy of our method in comparison with Manders' method, (B) two sample t-test results show that the individual distances dCBC
(k) (between CBCα(k) and Vt) are significantly smaller than the distances dM
(k) (between
  and Vt). *The y-axis in Figure B indicates dCBC
(k) and dM
(k), which is measured using the percentage of co-localisation.

