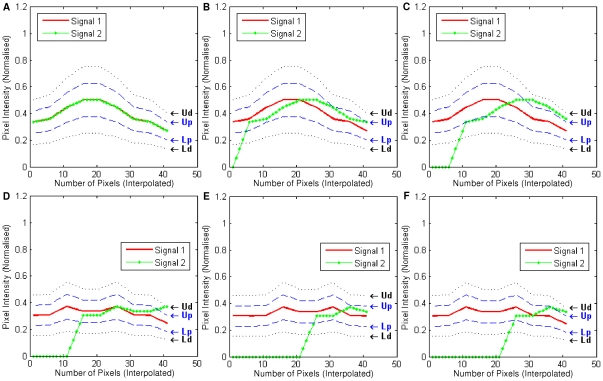
Figure 12. Plots of an edge and centre point of a dot from frame 5 for the first six test cases in .
 . Signal 1 is the image intensity values for a nine frame neighbourhood from colour channel Cα, whereas Signal 2 stands for Cβ. For both Signal 1 and 2, linear interpolation is applied to generate more data points.

