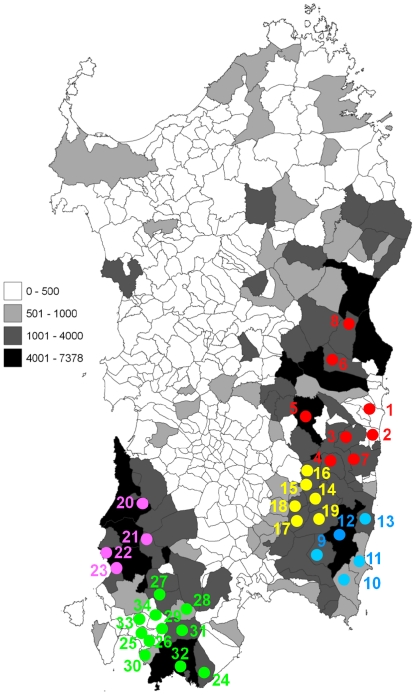
Figure 1. Map of Sardinia showing the 34 municipalities (dotted) where sampling was performed.
In the background all municipalities are shaded according to the overall number of goats recorded [23], as reported in the left panel (map obtained at http://www.sar.sardegna.it/servizi/sit/datitematici.asp?wgs=1). Sampled municipalities in 5 Sardinian sub regions are shown with the following color codes: Ogliastra-red, Sarrabus-blue, Gerrei-yellow, Iglesiente-purple and Sulcis-green. Detailed names and n. of breeding stations sampled are reported in Table S1.

