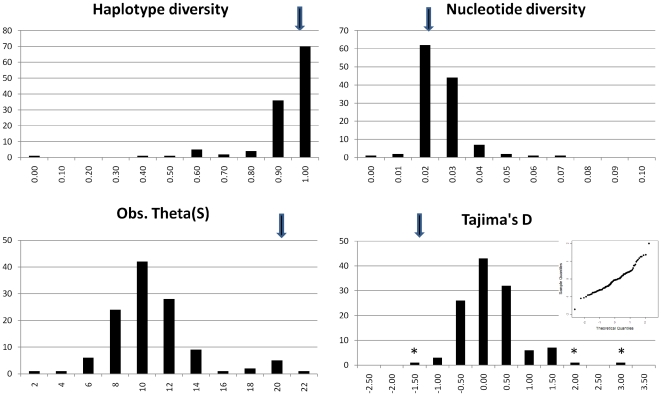
Figure 3. Histograms of four summary statistics for DNA diversity from 120 goat breeding stations.
Black arrows point to the value obtained in the overall dataset. In the Tajima's D histogram, significant (nominal p<0.05) values are marked with an asterisk and a normal QQ plot is shown in the inset.

