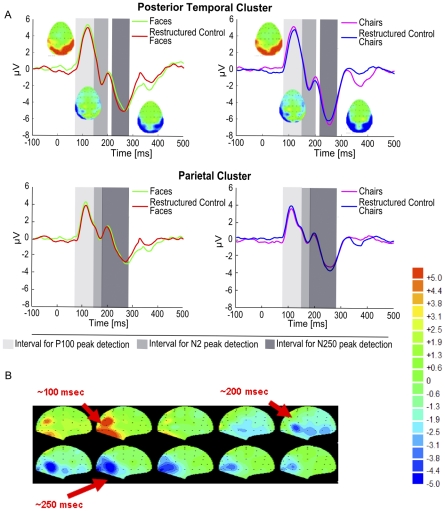
Figure 2. SFM-evoked ERP signals (Exp. 1A).
A The P1-N2-N250 pattern evoked by SFM stimuli of 860 ms duration is displayed for the posterior temporal and the parietal cluster. Voltage maps at corresponding time points are displayed for SFM face and chair elicited ERP signals. Group averaged ERPs showed no differences between SFM objects and associated restructured control stimuli at the N250 peak. The grey shaded areas indicate the time windows used for peak detection. B Voltage maps of the time points of interest for SFM faces. Activity in the occipital cortex is followed by more temporal (negative) activation at later time points (200–300 ms).

