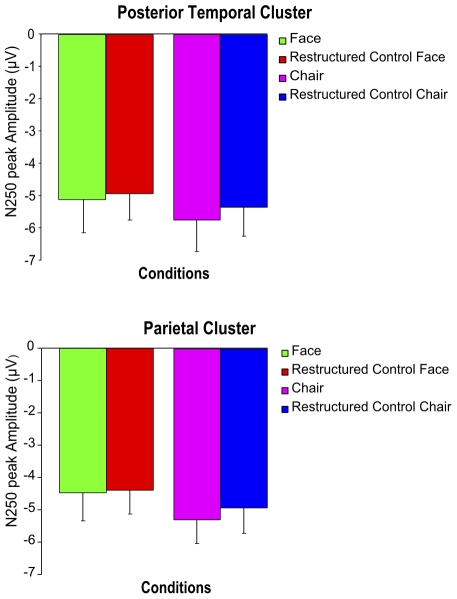
Figure 3. Visual features contribute to the amplitude of SFM-evoked ERP signals (Exp. 1A&B).
Bar graphs depicting the mean N250 amplitudes for the SFM object and restructured object conditions of 14 participants pooled for the two durations used in experiment 1 and 2 (160 ms and 860 ms). The results demonstrate that there is no significant difference in the N250 amplitude between meaningful categorical objects and corresponding meaningless control objects in the posterior temporal and the parietal clusters. Error bars indicate the SEM.

