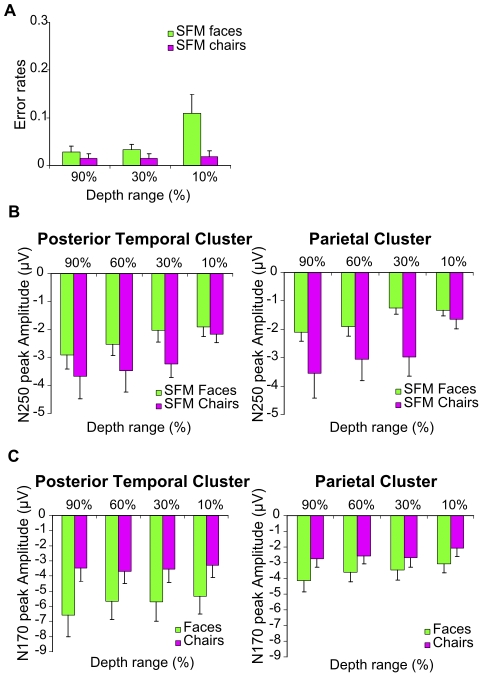
Figure 4. Depth range modulation of ERP signals (Exp. 2).
A Behavioral data indicate that a reduction in depth range of the SFM stimuli decreased recognition performance of faces but not of chairs. Bar graphs indicate the error rate and error bars indicate the SEM. B The N250 is modulated by SFM face and chair depth range in both posterior temporal and parietal clusters. C The N170 to static faces but not to static chairs is modulated by depth range in posterior temporal and parietal cluster. N170 amplitude in the posterior temporal cluster is larger in response to faces compared to chairs. Bar graphs show the mean amplitude of the peaks and error bars the SEM.

