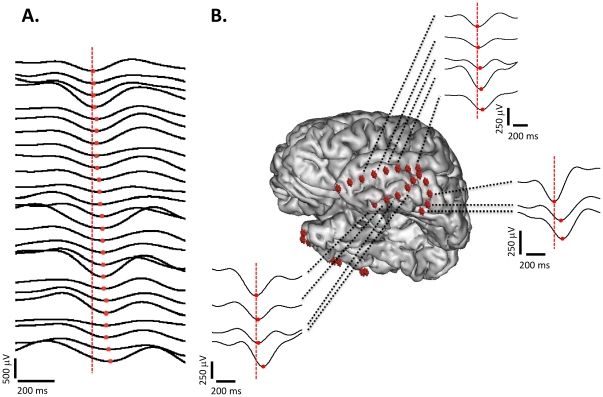
Figure 4. Propagation of the slow waves.
A. Filtered (0.1–4 Hz) signals of intracranial EEG contacts of one global slow wave event ordered as a function of the position of the minimum (red dots). The vertical dashed line marks the position of the minimum of the first detection. B. Three examples of local propagation in the temporal lobe. Each example corresponds to a different slow wave event. In all cases the signals are linked to the position of the recording contacts in the brain, represented by red cubes.

