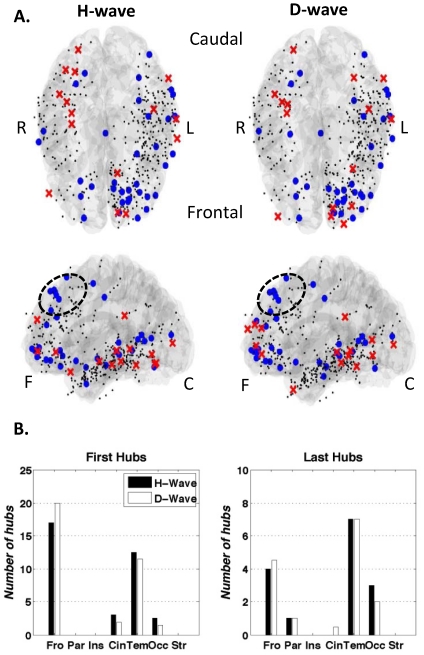
Figure 5.
Results of the propagation study. A. Left: First and last hubs of the H-wave propagation of all studied subjects superimposed on the same reference brain (Top and left views). Right: First and last hubs of the D-wave propagation of all studied subjects superimposed on the same reference brain (Top and left views). The little black dots correspond to the implanted contacts not presenting a first/last hub character. These are shown to illustrate the total coverage of the sum of the individual implantations. Please note the final coverage of the sum of all the implantations is not homogeneous with 295 (71%) contacts is the left hemisphere and 122 (29%) in the right hemisphere. B. Number of first/last hubs found in each of the following regions: Frontal (Fro), Parietal (Par), Insula (Ins), Cingulate cortex (Cin), Temporal (Tem), Occipital (Occ) and Striatum (Str).

