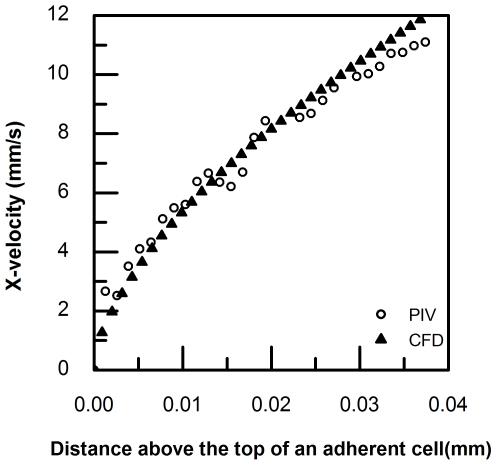
Figure 9. Comparison of μPIV measurements and CFD calculations.
The X-velocity profile was plotted with respect to the distance away from the cell surface on the top. Open circle (○) and solid triangle (▴) represent μPIV data and CFD calculations under a condition of high shear (365 µl min−1), respectively.

