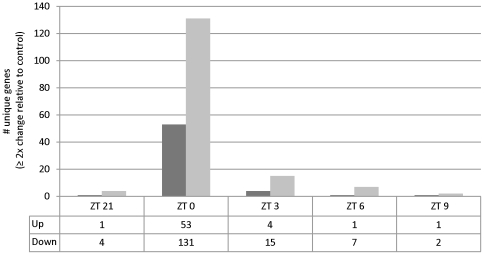
Figure 2. Microarray data from field grown plants.
Microarrays performed on tissue sampled throughout the day from two AtBBX32-expressing lines (lines 1 and 2 from Table 1) in the field demonstrate 219 genes show 2–8 fold changes (8-fold is maximum change observed) in abundance in both transgenic events relative to the control and that the majority of these changes occur around ZT 0 (6 am). Dark bar represents genes increased in abundance and light bar represents genes decreased in abundance. All changes significant at a false discovery rate of 5 percent.

