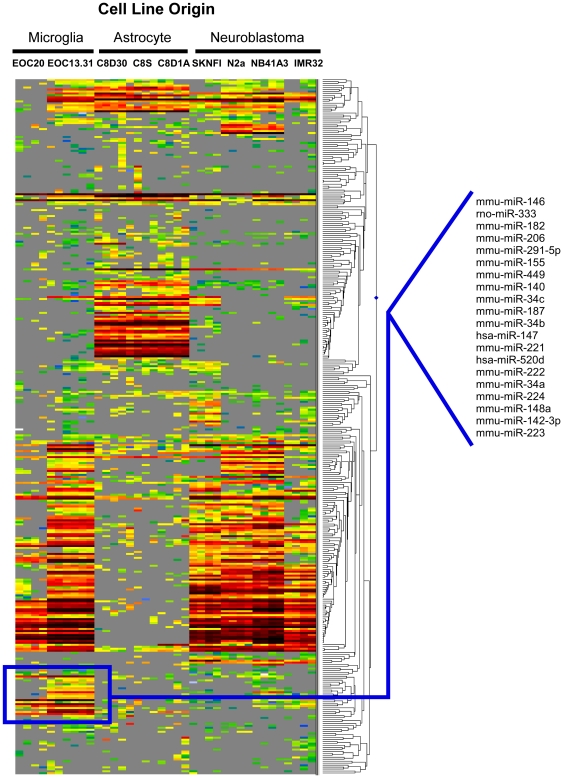
Figure 1. Hierarchical cluster plot generated from miRNA expression profiling of a repertoire of a variety of CNS cell lineages (neuronal, microglia, astrocytes).
A microglia specific cluster of miRNAs is indicated. Red indicates high levels of miRNA expression, green low levels and gray indicates expression that was undetected by the microarray used.

