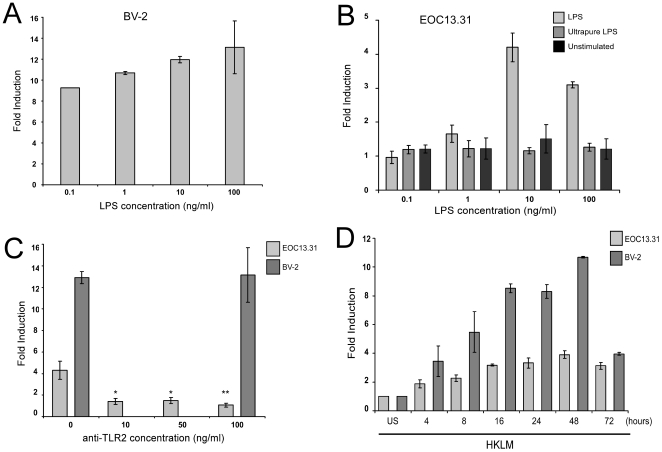
Figure 2. MiR-146a induction in microglia.
A. LPS at concentrations ranging from 0.1–100 ng/ml was used to stimulate BV-2 cells. After 8 hours, RNA was collected and TaqMan® qRT-PCR was used to determine miR-146a expression relative to PBS treated (unstimulated) control cells. The experiment was performed in triplicate and the average fold induction is shown. B. EOC 13.31 cells were stimulated with 100 ng/ml semi-pure LPS, 100 ng ultra-pure LPS or PBS alone (unstimulated). RNA was collected after 8 hours and miR-146a expression was measured by TaqMan® qRT-PCR. Fold induction relative to untreated cells is shown. The experiment was performed in triplicate and the average fold change is shown. C. EOC 13.31 cells were incubated with increasing concentrations of an anti-TLR2 antibody for 30 minutes prior to stimulation with 100 ng/ml LPS. MiR-146a expression relative to mock-treated control cells was measured by TaqMan® qRT-PCR. Inhibition of miR-146a expression following anti-TLR2 antibody treatment was significant at all concentrations; 10 and 50 ng/ml * p<0.01, 100 ng/ml ** p<0.005. Treatment of BV-2 cells with 100 ng/ml anti-TLR-2 antibody prior to LPS stimulation failed to inhibit miR-146a induction. The experiment was performed in triplicate and the average fold change is shown. D. EOC 13.31 and BV-2 cells were stimulated with with 108 heat-killed Listeria monocytogenes (HKLM) cells/ml. RNA was collected at various time-points over 72 hours and miR-146a expression measured by TaqMan® qRT-PCR. Fold induction relative to unstimulated cells (US) is shown. The experiment was performed in triplicate and the average fold change is shown.

