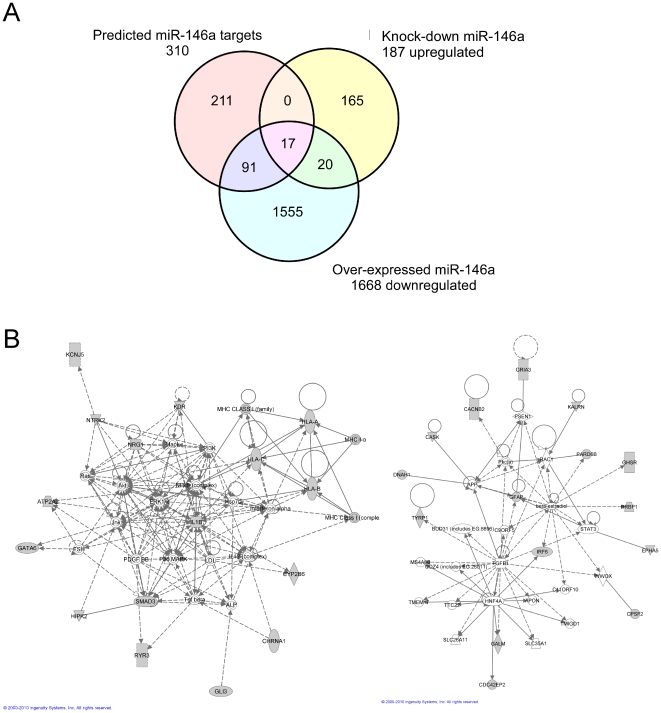
Figure 5. Analysis of genes dysregulated by over-expression, or knock-down of miR-146a in resting EOC 13.31 cells using either miRNA mimics or anti-miRs.
A. Venn diagram to show the intersection between genes down-regulated by miR-146a over-expression, up-regulated on miR-146a knock-down and those targets bioinformatically predicted using the TargetScan 5.1 program and IPA software. B. Networks showing the interactions between several predicted miR-146a target genes. Shaded grey are those genes also bioinformatically predicted using the TargetScan 5.1 program and IPA software.

