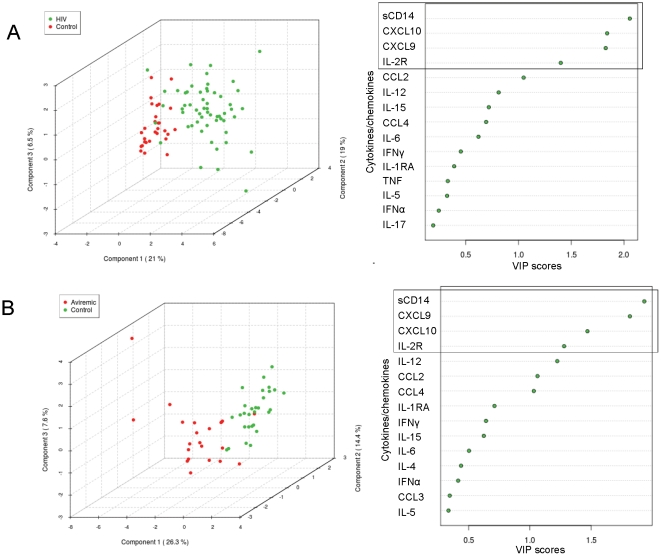
Figure 3. PLS-DA of 17 biomarkers shows separation of HIV subjects and aviremics from controls and identifies top-ranked biomarkers accounting for separation between groups.
(A) PLS-DA represented as a three dimensional scatter plot shows the top 3 components in the matrix of biomarker data (n = 17 biomarkers) measured in HIV (green dots, n = 57) and uninfected control subjects (red dots, n = 29). 46.5% of the variance observed in the matrix of biomarker data is explained by the first 3 components. Plot on the right shows variables important in projection (VIP) plot ranking sCD14, CXCL9, CXCL10, and sIL-2R as the top 4 biomarkers accounting for the variance between all HIV subjects and controls. (B) PLS-DA represented as a three dimensional scatter plot showing the top 3 components in the matrix of biomarker levels measured in aviremic HIV subjects (red dots, n = 22) and uninfected control samples (green dots, n = 29). 48.3% of the variance in the matrix of biomarkers is explained by the first 3 components. Plot on the right represents VIP plot ranking sCD14, CXCL9, CXCL10, and sIL-2R as the top 4 biomarkers explaining the variance between aviremic HIV subjects and uninfected controls.

