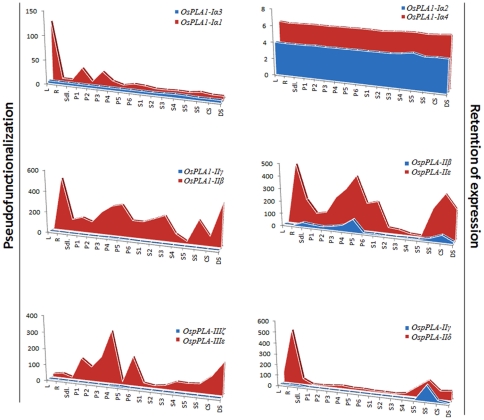
Figure 6. Expression pattern of duplicated PLA genes.
The expression values of segmentally and tandemly duplicated genes obtained from microarray data were compared in leaf (L), root (R) and seven day old seedling (SDL) tissue, in various stages of panicle development (P1–P6), seed development (S1–S5) and under cold stress (CS), dehydration stress (DS) and salt stress (SS). Each area graph represents compilation of the mean normalized signal intensity values from 17 stages of development/stress conditions. Gene pairs have been grouped into retention of expression and pseudo-functionalization based on their respective profile.

