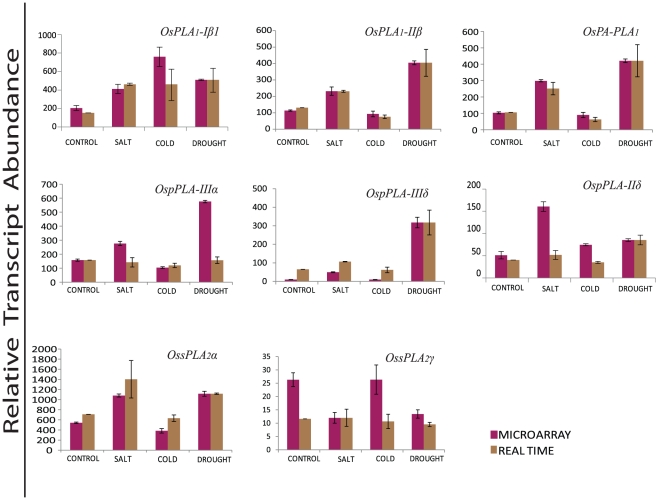
Figure 7. Validation of microarray expression profiles for selected PLA candidate genes by quantitative RT-PCR.
Real time PCR and microarray analysis was performed taking two and three biological replicates, respectively. Standard error bars have been shown for data obtained both from microarray and real time PCR. Y-axis represents raw expression values from microarray and normalized expression value from real time PCR and X-axis shows different experimental conditions; purple bars represent the expression from microarrays, while brown bars represent the real-time PCR values.

