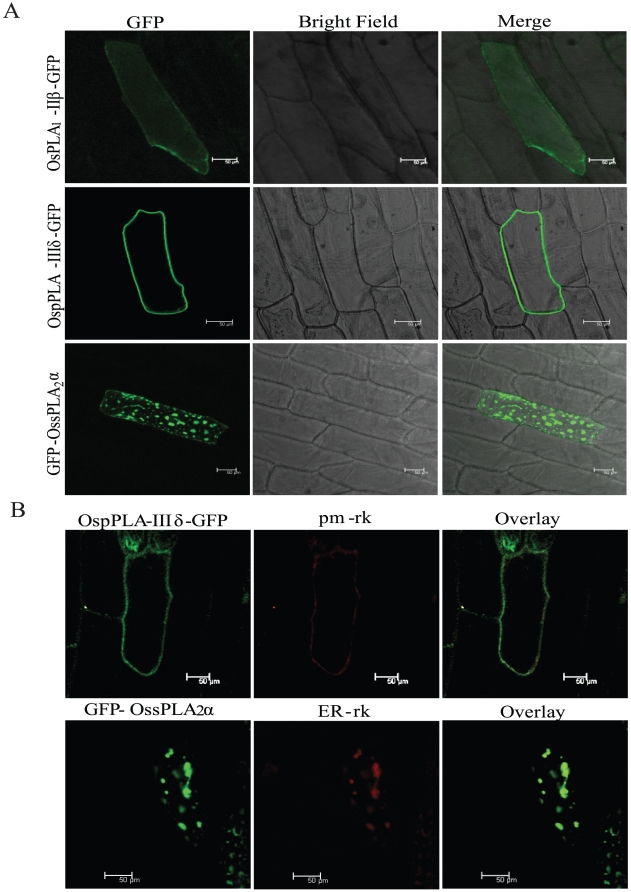
Figure 8. Sub-cellular localization of OsPLA proteins.
(A). Onion peel epidermal cells showing expression of the OsPLA - green fluorescent (GFP) fusion protein driven by the 35S promoter. Confocal images of fluorescence are shown for the expression of OsPLA1-IIβ-GFP fusion protein, showing its distribution throughout the cytoplasm (upper row), expression of OspPLA-IIIδ-GFP fusion protein showing their preferential accumulation in cell periphery (middle row) and of GFP-OssPLA-2α fusion in specific organelle in the cell (lower row). All the images were taken in 5 different sections in z direction and merges together. Scale bar = 50 µm. (B). Co-localization of PLA proteins with organelle markers. OspPLA-IIIδ-GFP showing GFP signal merges completely with plasma membrane marker (pm-rk) (upper panel) and GFP-OssPLA-2α was present as a large bright spot that co-localize with endoplasmic reticulum (ER) marker (ER-rk) (lower panel). GFP fusion to the OsPLA proteins are shown in green, mCherry organelle markers are shown in red and overlay of two mentioned protein in dark field view. All the images were taken in 5 different sections in z direction and merges together. Scale bar = 50 µm.

