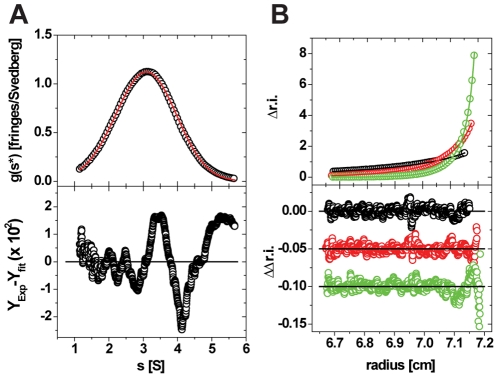
Figure 2. AUC results for the B25C-dimer.
A: SV Analysis of the B25C-dimer in the presence of 2 Zn2+/hexamer (insulin normals). In the top part of the figure, open circles represent the g(s*)/s-curve derived from a dcdt-analysis. For clarity, only every 10th data point is shown. The solid red line represents the fit to a model of a single ideal species, resulting in the parameters shown in Tabel 2. The bottom part of the figure represents the local deviations between the experimental and simulated data (residuals). Every data point is shown. The rmsd of the shown fit is 9.83×10⁻³. B: Representative data of a SE experiment used to determine the self-association model of B25C. In the top part of the figure, open circles represent experimental concentration distributions at apparent thermo- and hydrodynamic equilibrium for one concentration (out of five) at 15 krpm (black), 24 krpm (red) and 36 krpm (green). For clarity, only every 10th data point is shown. The solid like-colored lines represent the global fit to all measured conditions to a model of a reversible monomer-dimer model, resulting in the equilibrium coefficient mentioned in the text. The bottom part of the figure represents the local deviations between the experimental and simulated data (residuals). Every data point is shown. The molar mass parameter was fixed to its expected value and the global rmsd of the fit is 7.4×10⁻³.

