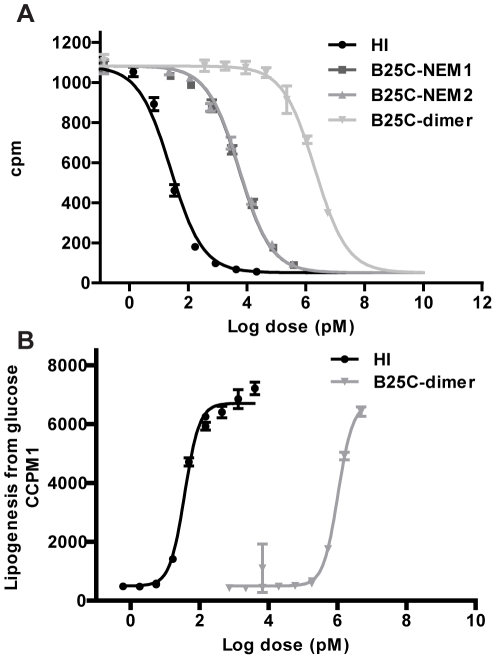
Figure 3. Measurements of in vitro activity of the B25C-dimer compared to HI.
A: Representative insulin receptor binding curves for HI(black), B25C-NEM1 (dark gray) B25C-NEM2(gray)and the B25C dimer(light gray). B: Representative metabolic dose response curves for HI(black) and the B25C-dimer (dark gray). Each point on the graph represents the mean ± SD, n = 4 within one assay.

