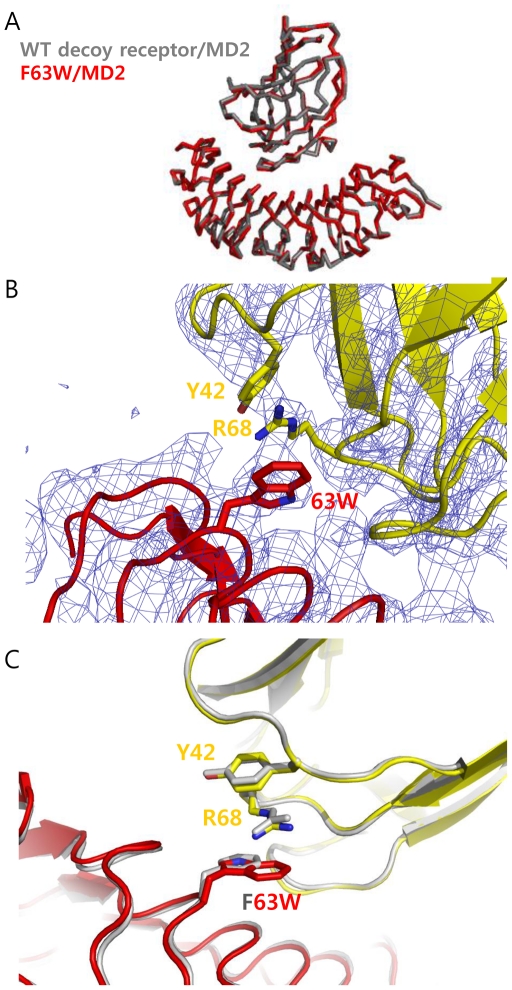
Figure 2. Crystal structure of the F63W mutant in complex with MD2.
(A) Superimposed backbone structure of F63W mutant/MD2 complex into the wild-type decoy receptor/MD2 complex structure. The F63W showed a slight movement toward the N-terminal direction by 0.4 Å compared to the wild-type decoy receptor in complex with MD2. (B) The complex structure of F63W mutant/MD2. The mutated Tyr-63 was closely located to Arg-68 on MD2, creating cation-π interaction. The F63W mutant in complex structure is indicated as red and MD2 of F63W/MD2 complex is colored in yellow. The electron density map of mutant complex is shown as blue. (C) Comparison of the wild-type decoy receptor/MD2 and F63W/MD2 complex structures. The key residues and backbone structure of wild-type decoy receptor/MD2 complex are shown in grey. In F63W/MD2 complex, the F63W mutant is shown in red, and MD2 in yellow, respectively.

