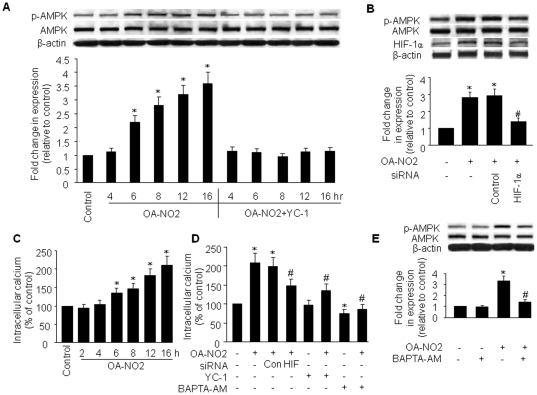
Figure 5. HIF-1α mediates OA-NO2-induced intracellular Ca2+ accumulation and AMPK activation.
A) BAECs were treated with YC-1 (30 µM) for 30 min followed by incubation with OA-NO2 for the indicated times. AMPK phosphorylation and protein levels were assayed as described in Materials and Methods. The blot is representative of three blots obtained from three independent experiments. B) BAECs were incubated with HIF-1α-specific siRNA or control siRNA for 48 h and then treated with OA-NO2 or vehicle for 16 h. After treatment, cell lysates were analyzed for HIF-1α and AMPK protein levels and AMPK phosphorylation at Thr172. Lower panels: summary data (*p<0.05 vs. control; # p<0.05 vs. OA-NO2 group; n = 3). C) BAECs were incubated with OA-NO2 (2.5 µM) for the indicated times. Intracellular Ca2+ was measured with Fluo-4 fluorescent dye as described in Materials and Methods. *p<0.01 vs. control (n = 4). D) BAECs were pre-treated with YC-1 (30 µM) or BAPT-AM (25 µM) for 30 min or HIF-1α siRNA or control siRNA for 48 h followed by incubation with OA-NO2 for 16 h. After treatment, intracellular Ca2+ was measured in intact cells using a Fluo-4 NW kit. *p<0.05 vs. control; # p<0.05 vs. OA-NO2 group (n = 3). E) BAECs were pre-loaded with 25 µM BAPT-AM for 30 min prior to incubation with 2.5 µM OA-NO2 for 16 h. AMPK protein levels and phosphorylation at Thr172 were detected as described above. Representative blots (top) and densitometric analyses (bottom) are shown. Values are means ± SD from three independent measurements. *p<0.05 vs. control; # p<0.05 vs. OA-NO2 group.

