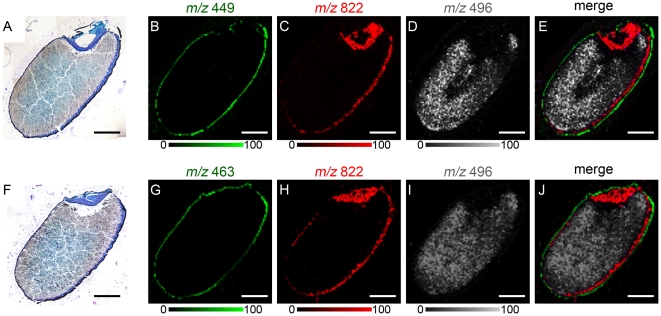
Figure 3. MALDI-IMS analysis of anthocyanins in black rice sections.
A, Black rice section stained with toluidine blue O after MALDI-IMS analysis of the ions at m/z 449. B, Localization pattern of the ions at m/z 449. C, Localization pattern of the ions at m/z 822 corresponding to PC (diacyl C36:3), which marks the nucellus epidermis/aleurone layer. D, Localization pattern of the ions at m/z 496 corresponding to LPC (C16:0), which marks the endosperm. E, Merged ion image of m/z 449 (red), m/z 822 (green) and m/z 496 (white). F, Black rice section stained with toluidine blue O after MALDI-IMS analysis of the ions at m/z 463. G, Localization pattern of the ions at m/z 463. H, Localization pattern of the ions at m/z 822 corresponding to PC (diacyl C36:3). I, Localization pattern of the ions at m/z 496 corresponding to LPC (C16:0). J, Merged ion image of m/z 463 (red), m/z 822 (green) and m/z 496 (white). Scale bar: 1.0 mm.

