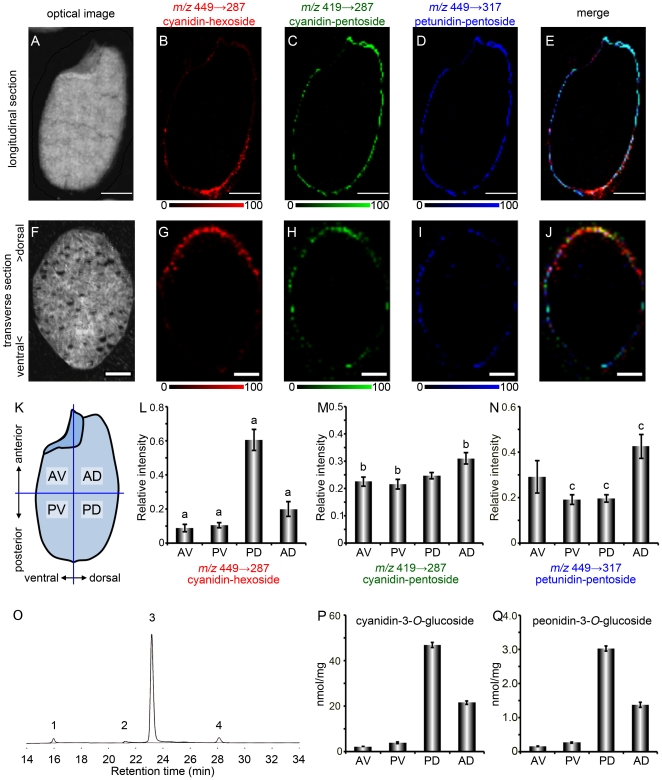
Figure 5. MALDI-IMS/MS analysis of ions at m/z 419 and m/z 449 on longitudinal or transverse sections of a black rice seed.
A–E, Longitudinal section images. Scale bar: 1.0 mm. F–J, Transverse section images. Upper side in transverse sections is the dorsal side of the black rice seed. Scale bar: 0.5 mm. A, F, Optical images. B, G, Localization pattern of the fragment ions at m/z 287, derived from the precursor ions at m/z 449, corresponding to cyanidin-3-O-hexoside. C, H, Localization pattern of the fragment ions at m/z 287, derived from the precursor ions at m/z 419, corresponding to cyanidin-3-O-pentoside. D, I, Localization pattern of the fragment ions at m/z 317, derived from the precursor ions at m/z 449, corresponding to petunidin-3-O-pentoside. E, J, Merged ion image of m/z 449→287 (red), m/z 419→287 (green), and m/z 449→317 (blue). K, Four regions defined in the intensity quantification of each fragment ion. L–N, Relative intensity of the fragment ions corresponding to cyanidin-3-O-hexoside (L), cyanidin-3-O-pentoside (M), and petunidin-3-O-pentoside (N). AV: anterior ventral region, PV: posterior ventral region, PD: posterior dorsal region, AD: anterior dorsal region. Data was collected from 7 sections of 3 black rice seeds (means ± S.E.). Different denote significant differences among groups means from a Tukey-Kramer test (p<0.01). O, HPLC chromatogram of anthocyanins in the black rice crude extract. Peak 1 and 2, unknown; peak 3, cyanidin-3-O-glucoside; peak 4, peonidin-3-O-glucoside. P, Q, Contents of cyanidin-3-O-glucoside (P) and peonidin-3-O-glucoside (Q) in each part of black rice seeds determined by HPLC and expressed in nmol per mg of seed pieces ± S.E in triplicate.

