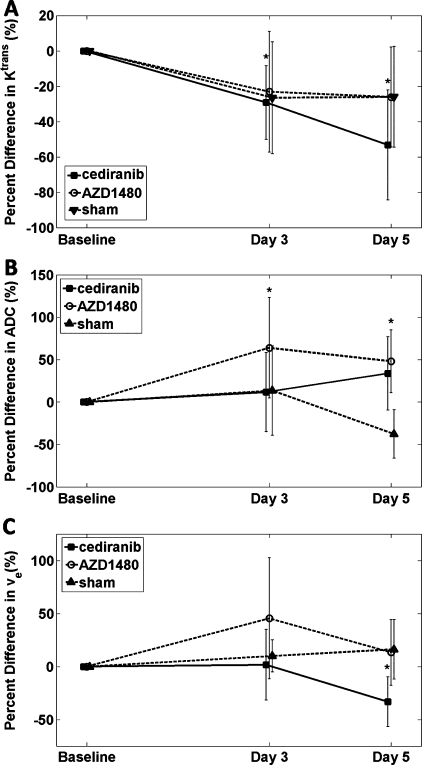
Figure 3.
(A, B, and C) Percent change from baseline for Ktrans, ADC, and ve, respectively, from a center slice ROI where cediranib (▪), AZD1480 (○), and Sham (▴), whereas the 95% confidence intervals are represented by the vertical bars. *P < .05. Statistical significance was found for Ktrans in the cediranib treatment group, whereas AZD1480 days 3 and 5 data showed significant increases in ADC. A significant decrease was found for ve in the cediranib treatment group. See text for additional details.

