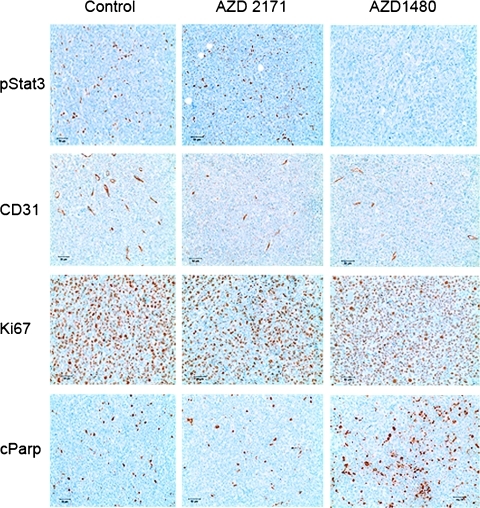
Figure 9.
Sample staining for pSTAT3 (first row), CD31 (second row), Ki-67 (third row), and cParp (last row) for sham group (first column), the cediranib treatment group (second column), and the AZD1480 treatment group (last column). There is clear evidence that pSTAT3 in AZD1480 is suppressed in treated animals (no brown staining). The brown staining shown in the CD31 staining indicates a positive stain for CD31 on endothelial cells, whereas a brown staining in the Ki-67 images indicates cells that are in a proliferative state. The brown staining for the cParp images indicate cells positive for the Parp cleavage typically characterized by cells undergoing apoptosis.

