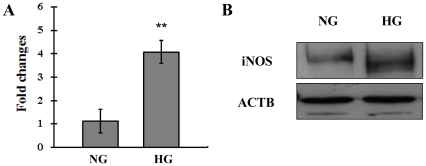
Figure 2. Expression levels of mRNA and protein of iNOS in the high glucose cultured human RPE cells.
(A) Expression iNOS mRNA in D407 cells was determined by real-time polymerase chain reaction. The change in gene expression is expressed as fold change in relation to the control. Data are means ± SE of four independent experiments. **P<0.01 compared with cells incubated in the control. (B) Western blot analysis using monoclonal antibodies against iNOS and ACTB. The data represent a western blot analysis from an individual experiment performed at least 3 times. NG, normal glucose; HG, high glucose; iNOS, inducible nitrate oxide synthase.

