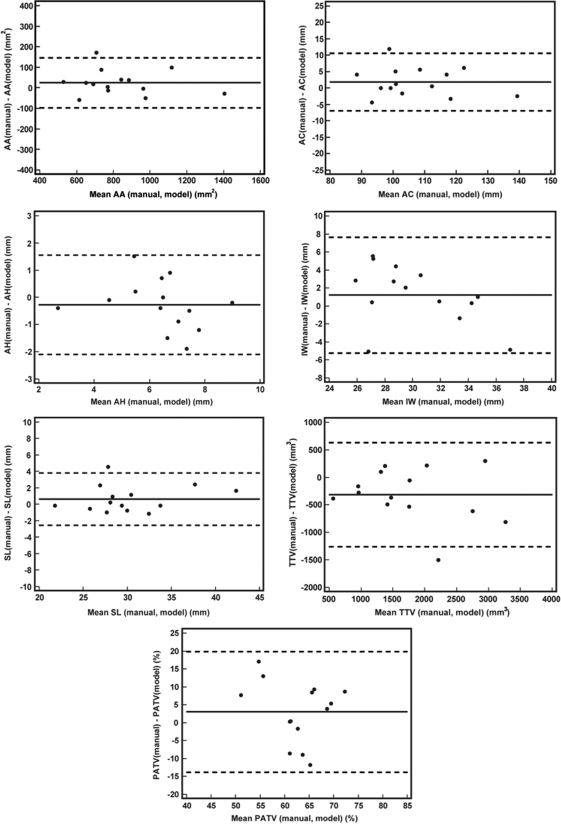
Figure 9.
Bland-Alman plots showing the difference between manual and automated measurements as a function of the mean measurement for each of 14 patients. (AA = annular area, AC = annular circumference, AH = annular height, IW = intercommissural width, SL = septolateral length, TTV = total tenting volume, PATV = percent anterior tenting volume).

