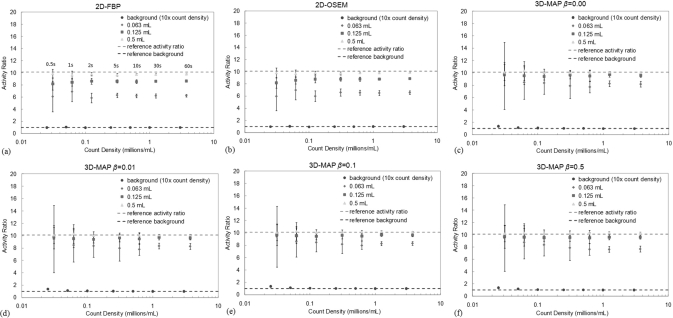
Figure 4.
Activity concentration ratio between spheres and surrounding background area for (a) 2D-FBP, (b) 2D-OSEM, (c) 3D-MAP β = 0, (d) 3D-MAP β = 0.01, (e) 3D-MAP β = 0.1 and (f) 3D-MAP β = 0.5) with various scan durations. Error bars indicate statistical uncertainty over the different realizations. A ratio of 10.11 indicates complete recovery of the activity. The count densities in the background area were multiplied by 10 for this presentation.

